
1、创建
创建vue文件,引入dev基本组件
import DxPieChart, {
  DxLegend,
  DxSeries,
  DxLabel,
  DxConnector,
  DxFont,
} from 'devextreme-vue/pie-chart'
源码
<!--
 * @Descripttion: 饼状图组件
 * @version: 0.0.1
 * @Author: PengShuai
 * @Date: 2022-11-07 14:29:44
 * @LastEditors: PengShuai
 * @LastEditTime: 2022-11-07 14:32:14
-->
<template>
  <div class="BasePieChart">
    <!-- palette 饼状图颜色 -->
    <DxPieChart
      id="pie"
      :data-source="pieData"
      palette="Pastel"
      :title="pieConfig.title"
    >
      <DxSeries
        :argument-field="pieConfig.argumentFieId"
        :value-field="pieConfig.valueFieId"
      >
        <DxLabel
          :visible="true"
          position="columns"
          :customize-text="formatLabel"
        >
          <DxConnector :visible="true" :width="1" format="percent" />
          <DxFont :size="pieConfig.size" />
        </DxLabel>
      </DxSeries>
      <DxLegend
        :column-count="6"
        orientation="horizontal"
        item-text-position="right"
        horizontal-alignment="center"
        vertical-alignment="bottom"
      />
    </DxPieChart>
  </div>
</template>

<script>
import DxPieChart, {
  DxLegend,
  DxSeries,
  DxLabel,
  DxConnector,
  DxFont,
} from 'devextreme-vue/pie-chart'
export default {
  name: 'BasePieChart',
  components: {
    DxPieChart,
    DxSeries,
    DxLabel,
    DxConnector,
    DxLegend,
    DxFont,
  },
  props: {
    // 饼状图数据源
    pieData: {
      type: Array,
      default: () => {
        return []
      },
    },
    // 饼状图配置
    pieConfig: {
      type: Object,
      default: () => {
        return {}
      },
    },
  },
  methods: {
    formatLabel(pointInfo) {
      let label = ''
      // 1 名称+值+百分比
      // 2 值+百分比
      // 默认 值
      if (this.pieConfig.labelType === '1') {
        label =
          pointInfo.argument +
          ' ' +
          '(' +
          pointInfo.valueText +
          ')' +
          ' ' +
          pointInfo.percentText
      } else if (this.pieConfig.labelType === '2') {
        label = pointInfo.valueText + pointInfo.percentText
      } else {
        label = pointInfo.valueText
      }
      return label
    },
  },
}
</script>

<style></style>
2、使用组件
<!--
* @Descripttion: 饼状图
* @version: 0.0.1
* @Author: PengShuai
* @Date: 2022-11-07 14:28:15
* @LastEditors: PengShuai
* @LastEditTime: 2022-11-07 14:36:02
-->
v
<template>
<div class="PieChart">
<base-pie-chart
:pieData="pieAllData"
:pieConfig="pieConfig"
></base-pie-chart>
</div>
</template>
<script>
import BasePieChart from '@/components/BasePieChart'
export default {
name: 'PieChart',
components: {
BasePieChart,
},
data() {
return {
// 饼状图数据
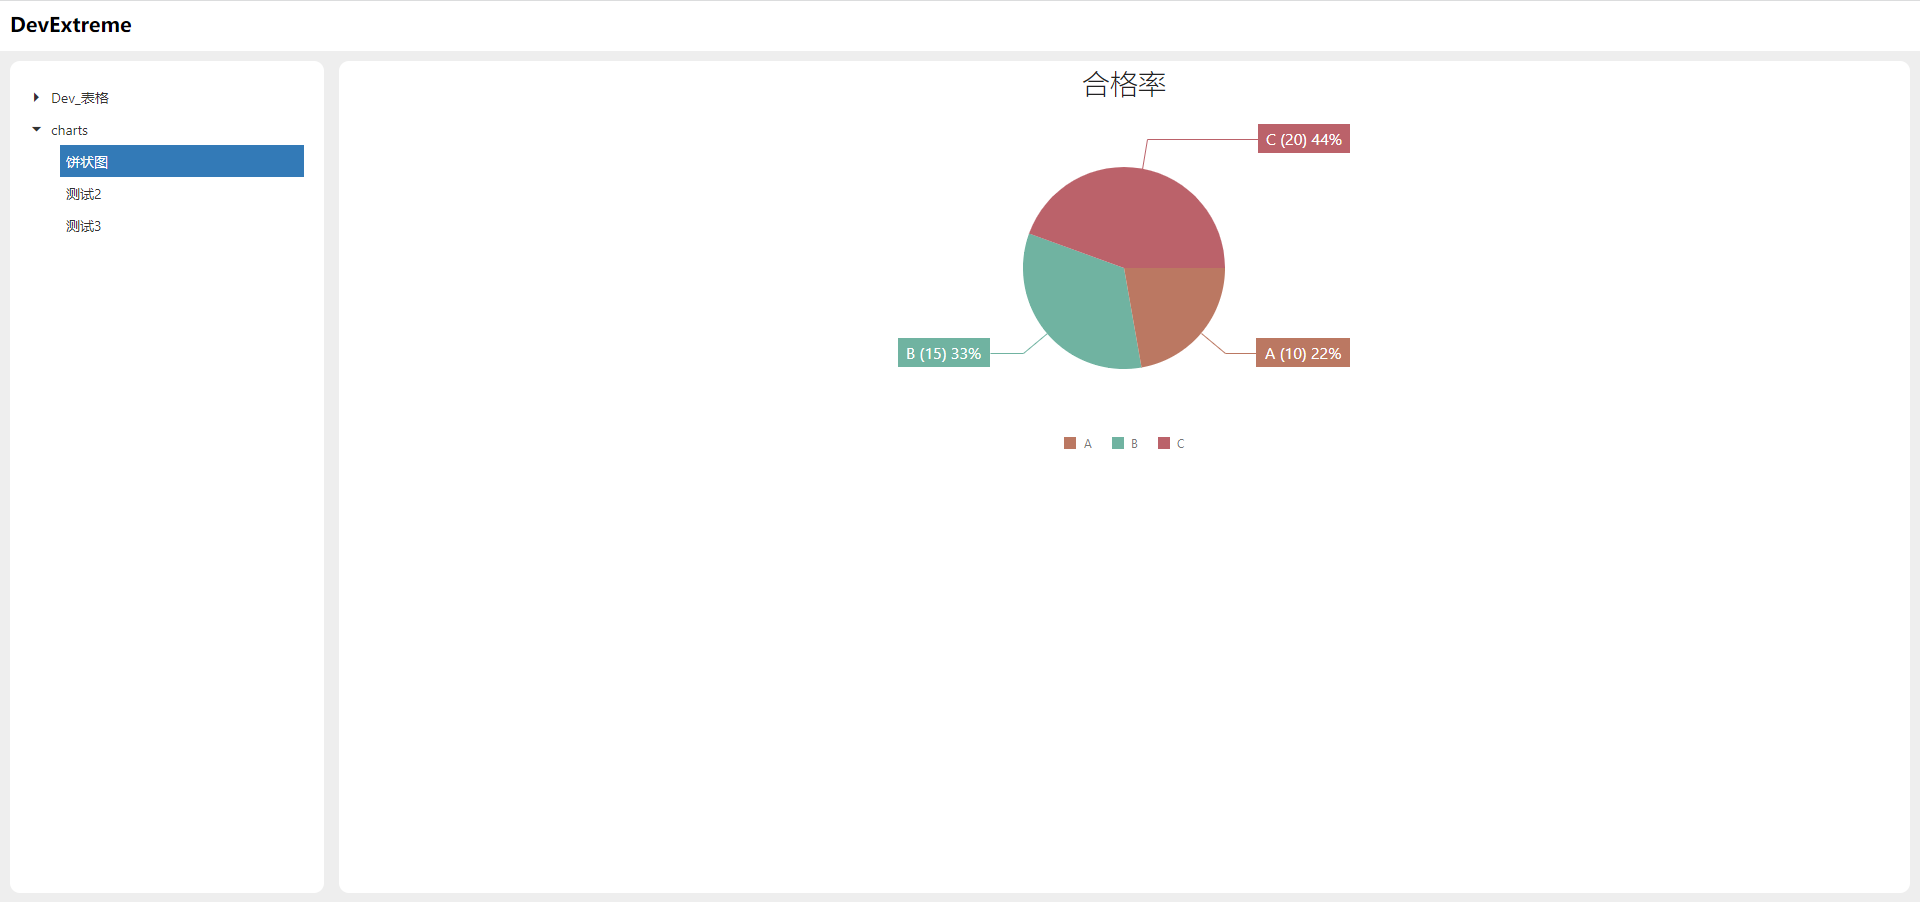
pieAllData: [
{
label: 'A',
number: '10',
},
{
label: 'B',
number: '15',
},
{
label: 'C',
number: '20',
},
],
// 饼状图配置
pieConfig: {
title: '合格率', // 标题名称
argumentFieId: 'label', // 显示图列字段
valueFieId: 'number', // 图表显示字段
labelType: '1', // 默认null 值 显示值类型 1、名称+值+百分比 2 值+百分比
size: 16, // 显示提示文字大小,类型 Number
},
}
},
}
</script>
<style></style>
3、示例
原文地址:http://www.cnblogs.com/psmart/p/16865916.html
1. 本站所有资源来源于用户上传和网络,如有侵权请邮件联系站长!
2. 分享目的仅供大家学习和交流,请务用于商业用途!
3. 如果你也有好源码或者教程,可以到用户中心发布,分享有积分奖励和额外收入!
4. 本站提供的源码、模板、插件等等其他资源,都不包含技术服务请大家谅解!
5. 如有链接无法下载、失效或广告,请联系管理员处理!
6. 本站资源售价只是赞助,收取费用仅维持本站的日常运营所需!
7. 如遇到加密压缩包,默认解压密码为"gltf",如遇到无法解压的请联系管理员!
8. 因为资源和程序源码均为可复制品,所以不支持任何理由的退款兑现,请斟酌后支付下载
声明:如果标题没有注明"已测试"或者"测试可用"等字样的资源源码均未经过站长测试.特别注意没有标注的源码不保证任何可用性